TM1 CubeMap — User Guide
Phase 1 — Early Release. CubeMap is in active development. Core features are working but you may encounter rough edges. Feedback and bug reports welcome via GitHub Issues.
What is CubeMap?
CubeMap turns your TM1 / Planning Analytics model into an interactive data lineage diagram. Every cube, TI process, and Python ETL script becomes a node on the graph; every rule reference, TI read/write, and script dependency becomes a directed edge.
Key Features
| Feature | Description |
|---|---|
| Graph visualisation | All cubes, TI processes, and Python ETL scripts as a navigable diagram with directed edges showing data flow |
| Calculation Trace | Trace where a value comes from — walks DB() references in rules, TI processes that feed each cube, and ExecuteProcess chains |
| Rule inspection | Click any cube to see its full rules text, metrics (lines, DB() refs, feeders), and upstream/downstream connections |
| TI code viewer | Click any TI process node to see all four code sections (Prolog, Metadata, Data, Epilog) |
| Tags | Tag cubes and processes with custom labels for filtering and organisation |
| Layouts | Save and restore named node position layouts |
| AI documentation | Generate AI-ready prompts for individual objects or entire tagged modules |
| Multi-server | Switch between TM1 instances and databases from the toolbar without restarting |
Who uses it
| Role | What they do |
|---|---|
| TM1 Developer | Understands data flow, traces calculation chains, inspects rules and TI code |
| Solution Architect | Maps cube dependencies before refactoring or migrating a model |
| Finance Analyst | Traces where a balance or metric originates without reading raw TM1 rules |
| IT / Data Governance | Documents the model, tags objects by business area, exports AI specs for migration |
Quick Start
1. Prerequisites
- TM1 V11 on-prem server (V12 also supported)
- REST API enabled on the TM1 server
- Docker (recommended) OR Python 3.10+
2. Start CubeMap
Docker (recommended):
mkdir tm1-cubemap && cd tm1-cubemap
curl -sSLO https://raw.githubusercontent.com/falconbi/tm1_cubemap/main/docker-compose.yml
docker compose up -d
Python (manual install):
python3 -m venv venv && source venv/bin/activate
pip install -r requirements.txt
mkdir config && cp servers.json.example config/servers.json
cp .env.example .env
python3 app.py
3. Connect to your TM1 server
Docker: Open http://localhost:8084 — a setup form appears on first run.
Fill in your server details and click Save. No files to edit manually.
Python: Edit config/servers.json before starting. See Configuration for field descriptions.
4. Extract your model
Click Refresh in the toolbar. CubeMap connects to your TM1 server and extracts:
- All non-system cubes with dimensions, measures, and rules text
- TI process code (all four sections) and cube read/write edges
- Python ETL script edges (if configured in
cube_map/python_sources.json)
Extraction runs in the background — a spinner shows progress. The graph renders automatically when complete.
Configuration
servers.json
Each entry in the JSON array is a TM1 server with one or more databases.
| Field | Required | Description |
|---|---|---|
name | yes | Display name shown in the instance dropdown |
address | yes | TM1 server IP or hostname |
auth | yes | "v11" (Basic auth) or "v12" (OAuth2 client credentials) |
user | yes | Admin username |
password | V11 only | Admin password |
client_id / client_secret | V12 only | OAuth2 credentials from your TM1 server registration |
databases | yes | Array of databases on this server |
databases[].name | yes | TM1 database name |
databases[].port | yes | TM1 REST API port (typically 8000–8015 for V11, 4444 for V12) |
V11 example:
{
  "name": "Production V11",
  "address": "192.168.1.100",
  "auth": "v11",
  "user": "admin",
  "password": "apple",
  "databases": [
    {"name": "Finance", "port": 8000},
    {"name": "Budget",  "port": 8001}
  ]
}
V12 example:
{
  "name": "Production V12",
  "address": "192.168.1.101",
  "auth": "v12",
  "user": "admin",
  "client_id": "your-client-id",
  "client_secret": "your-client-secret",
  "databases": [
    {"name": "Finance", "port": 4444}
  ]
}
Multiple servers: Add multiple entries to the array. Switch between them from the server dropdown in the toolbar without restarting.
.env
| Variable | Default | Description |
|---|---|---|
PORT | 8084 | Flask server port |
Interface Guide
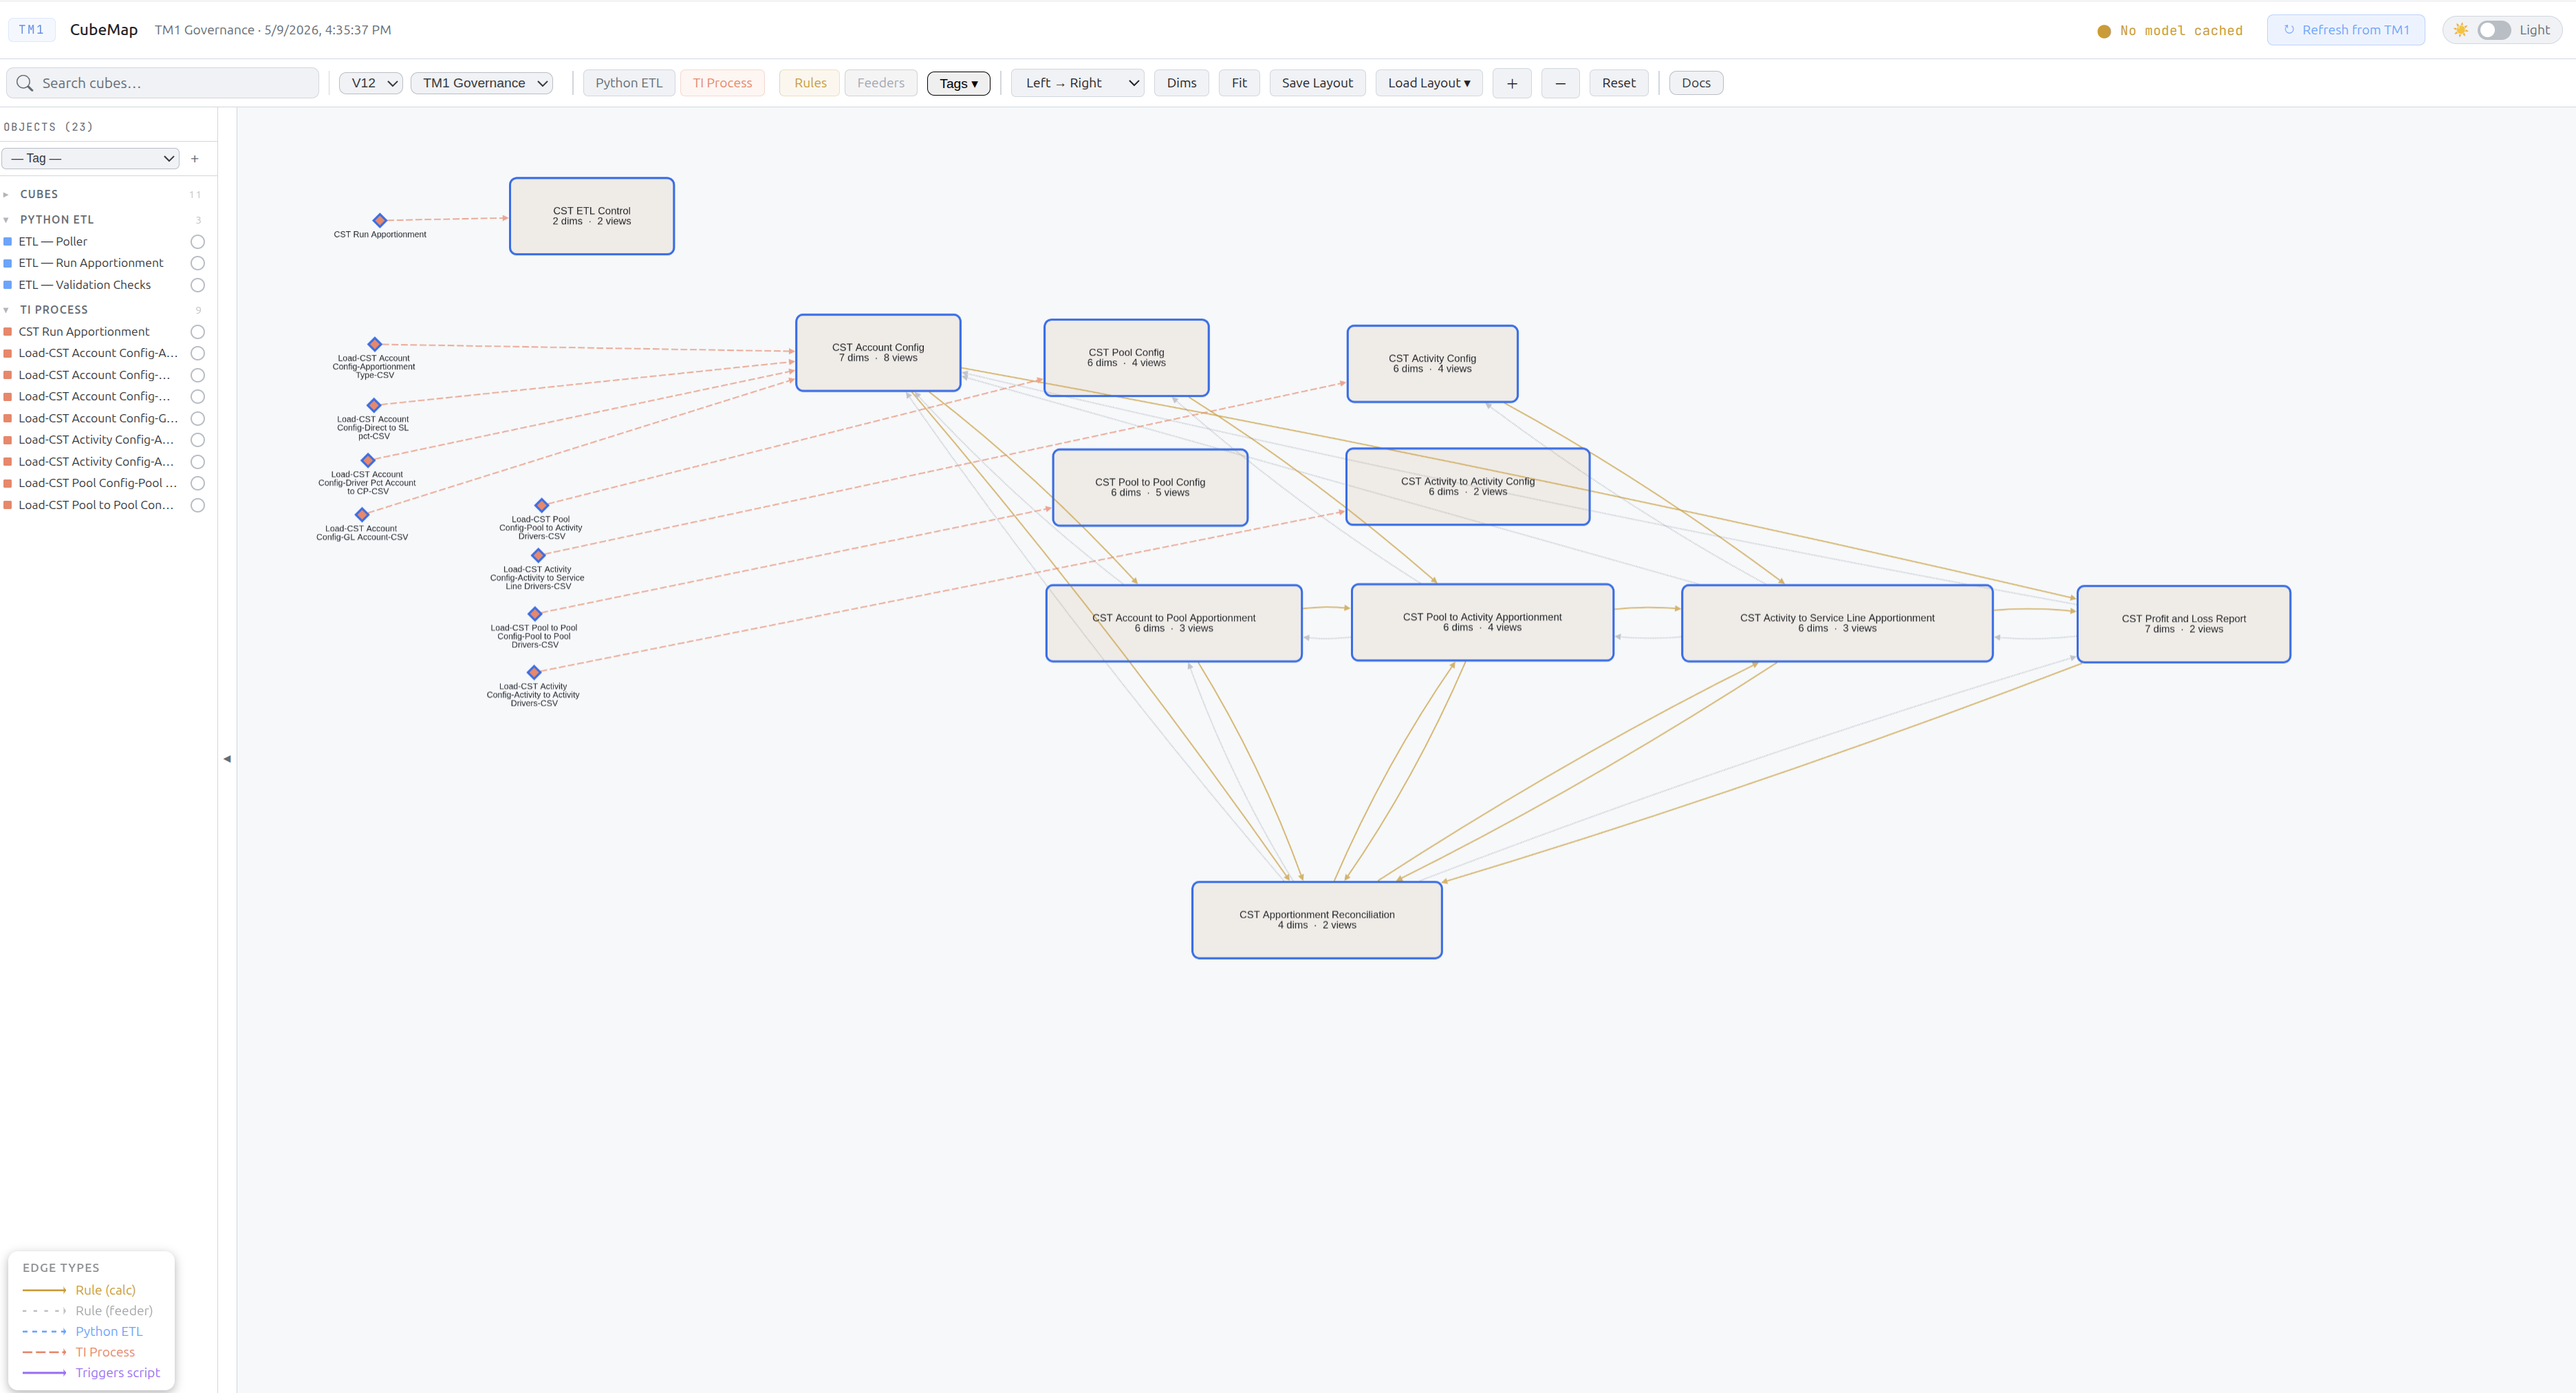
Graph (centre)
The main graph shows all extracted objects as nodes with directed edges showing data flow.
Node shapes:
| Shape | Type |
|---|---|
| Rounded rectangle | Cube |
| Diamond | TI Process |
| Hexagon | Python ETL script |
Edge styles:
| Style | Meaning |
|---|---|
| Gold solid | Rule calculation — a DB() reference in the rules calc section |
| Grey dotted | Rule feeder — a DB() reference in the feeders section |
| Orange dashed | TI Process read or write to a cube |
| Blue dashed | Python ETL data flow |
| Purple solid | ExecuteProcess call from one TI to another |
Navigation:
- Click any node to open its detail panel on the right
- Drag the canvas to pan
- Scroll to zoom in and out
- Drag individual nodes to rearrange — save with Save Layout in the toolbar
- Double-click a node to fit the view around its immediate neighbours
Toolbar
| Control | Description |
|---|---|
| Search | Filter nodes by name — clears on Escape |
| Server dropdown | Switch TM1 instance and database — triggers a model reload |
| Python ETL | Toggle Python ETL nodes and their edges on/off |
| TI Process | Toggle TI Process nodes and their edges on/off |
| Rules | Toggle rule calc edges on/off |
| Feeders | Toggle rule feeder edges on/off |
| Tags | Filter graph to show only cubes with specific tags |
| Copy Module Prompt | Generate an AI documentation bundle for all tagged objects (appears when a tag filter is active) |
| Layout select | Switch between Left→Right, Top→Bottom, Concentric, Circle, and Force-Directed layouts |
| Dims | Toggle dimension name labels on cube nodes |
| Fit | Reset zoom and pan to fit all visible nodes |
| Save Layout | Save current node positions under the active layout name |
| Load Layout | Restore a previously saved node position layout |
| + / - | Zoom in / zoom out |
| Reset | Clear all filters and restore default view |
| Docs | Open this documentation in a new tab |
Sidebar (left)
Lists all objects grouped by type — Cubes, TI Processes, Python ETL. Each group shows a count.
- Click any item to navigate the graph to that node and centre it on screen
- Use the Tags dropdown at the top to filter the sidebar and graph to a specific tag
Detail panel (right)
Click any node to open its detail panel. The panel has three tabs.
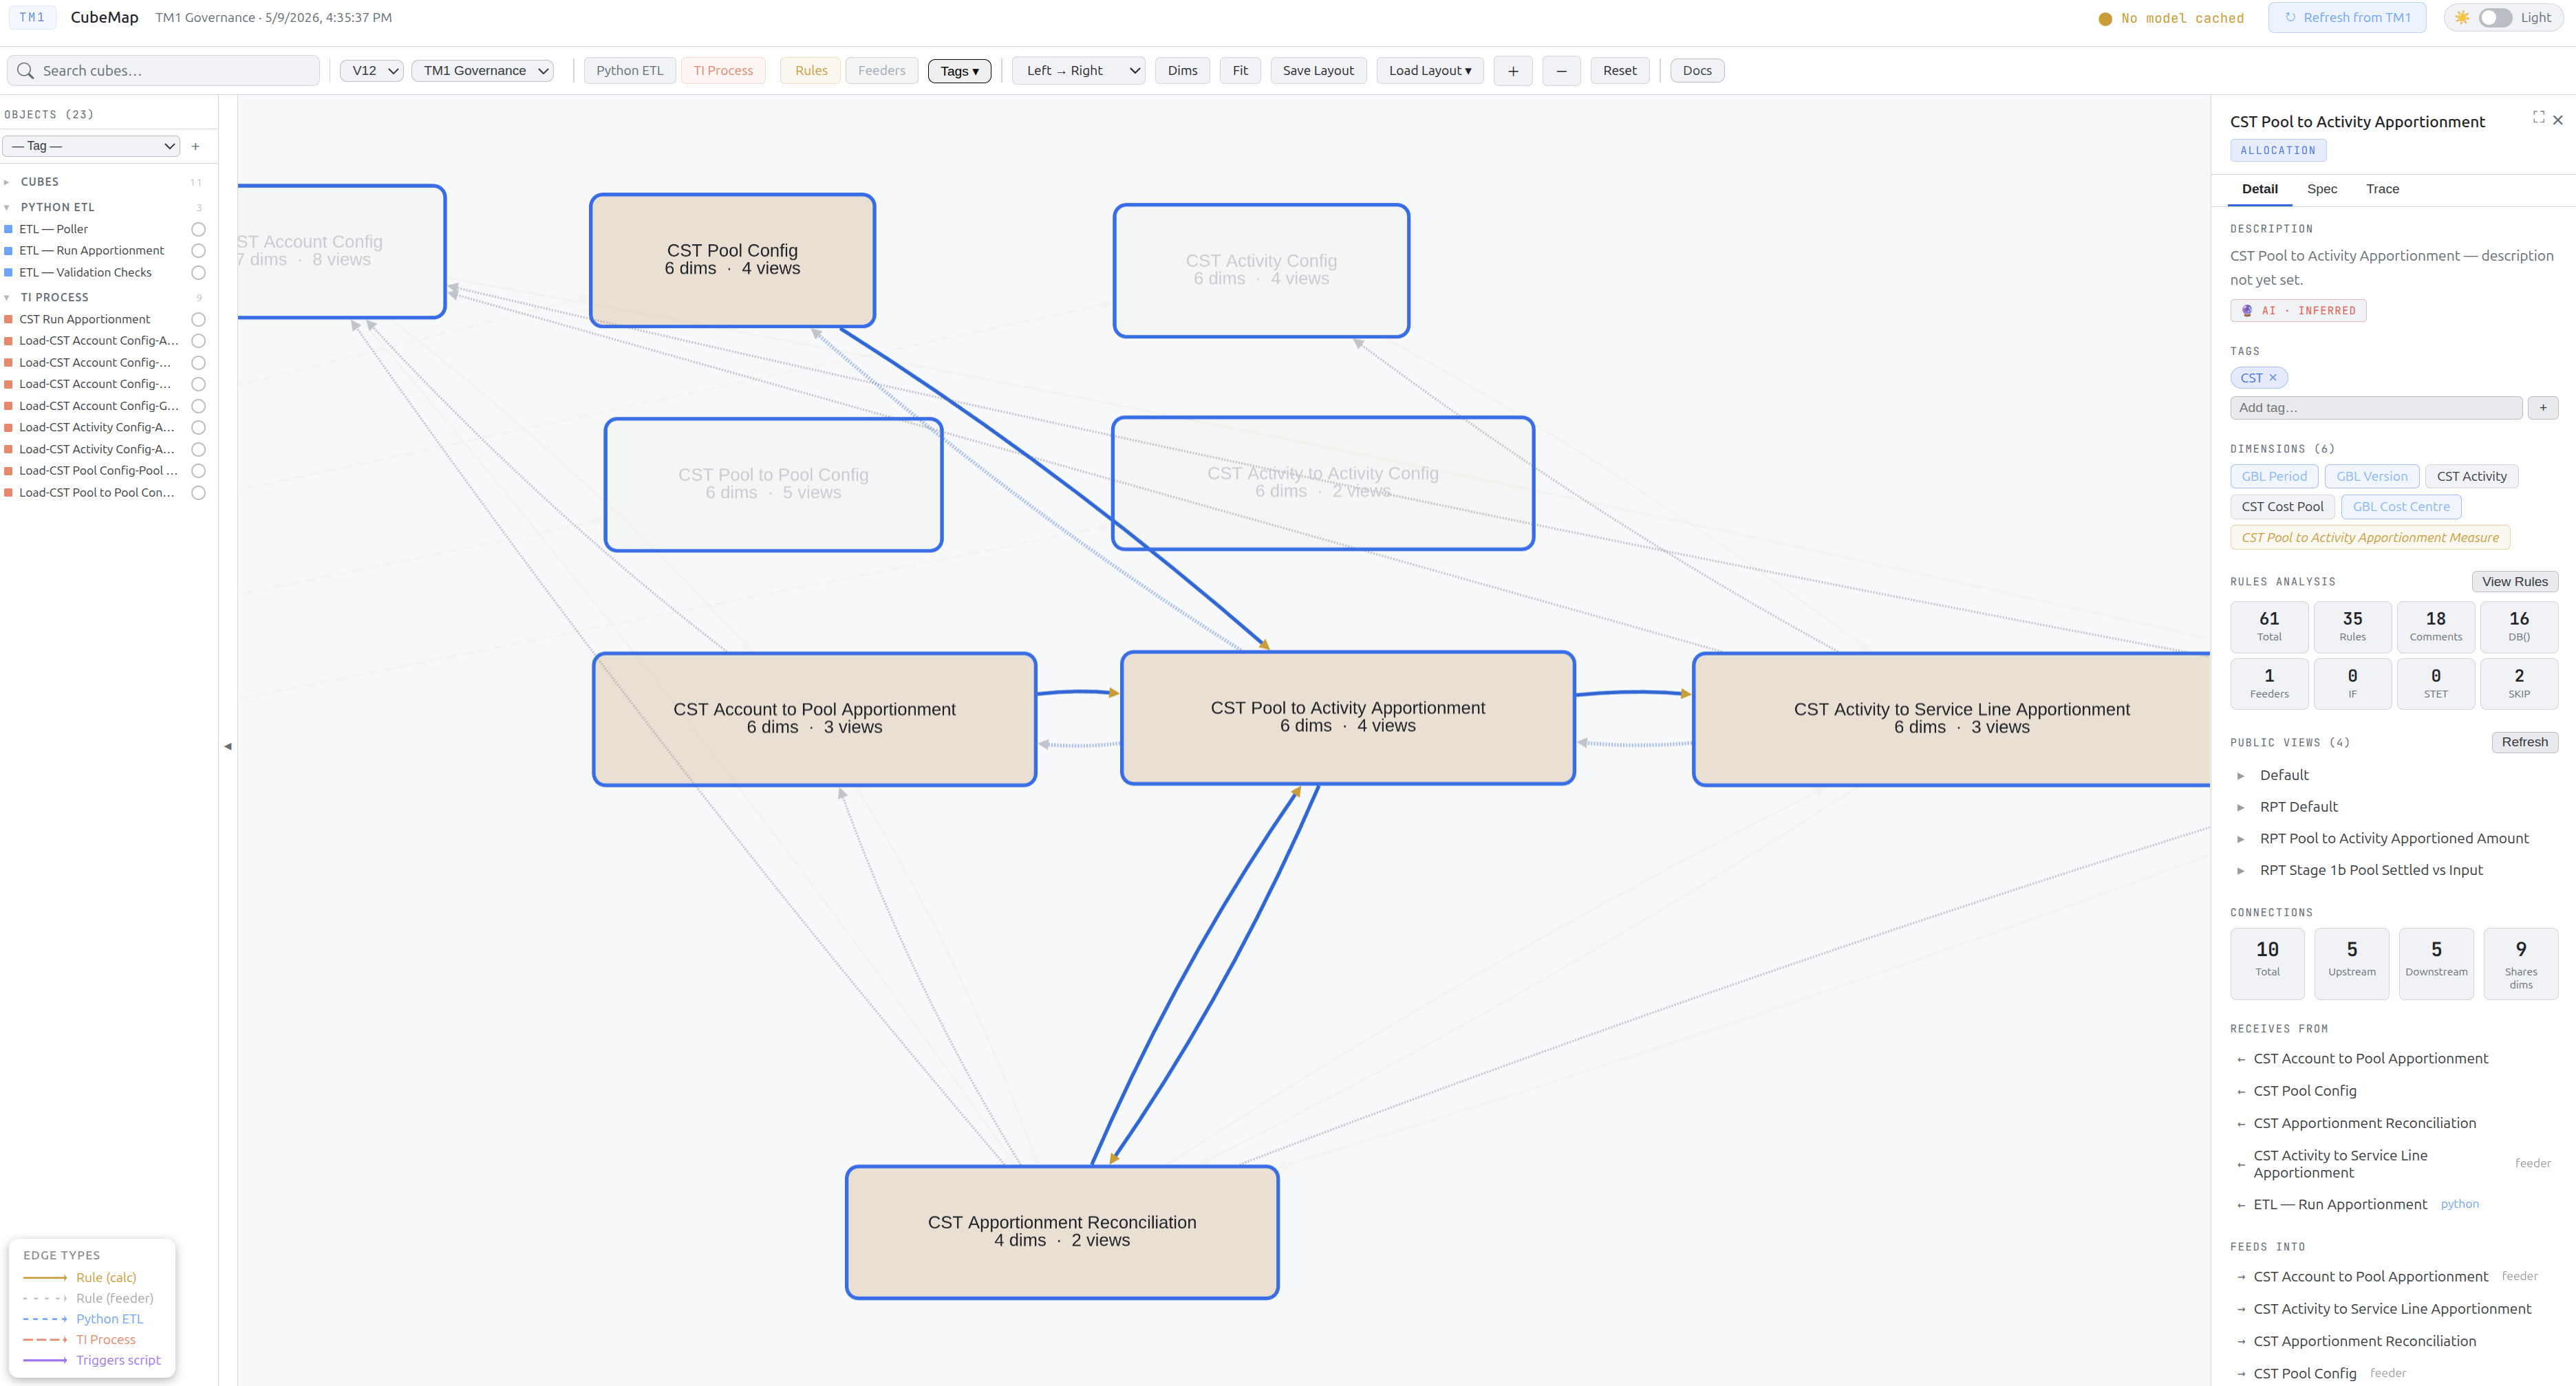
Detail tab:
| Section | Description |
|---|---|
| Name + type badge | Object name and colour-coded type label |
| Description | Editable description with source badge: Manual, AI Rules, or AI Inferred |
| Tags | Add, remove, or create new colour-coded tags |
| Dimensions | List of all dimensions on the cube |
| Rules analysis | Metrics: total lines, DB() refs, IFs, FEEDERS lines, calculated measures. Click View Rules to see the full rules text |
| Views | Public views defined on this cube |
| Connections | Upstream (feeds into this object) and downstream (this object feeds into) — with edge-type badges. Click any connected object to navigate to it |
Spec tab:
Displays AI-generated or manually written functional specifications. See AI Documentation for the full workflow.
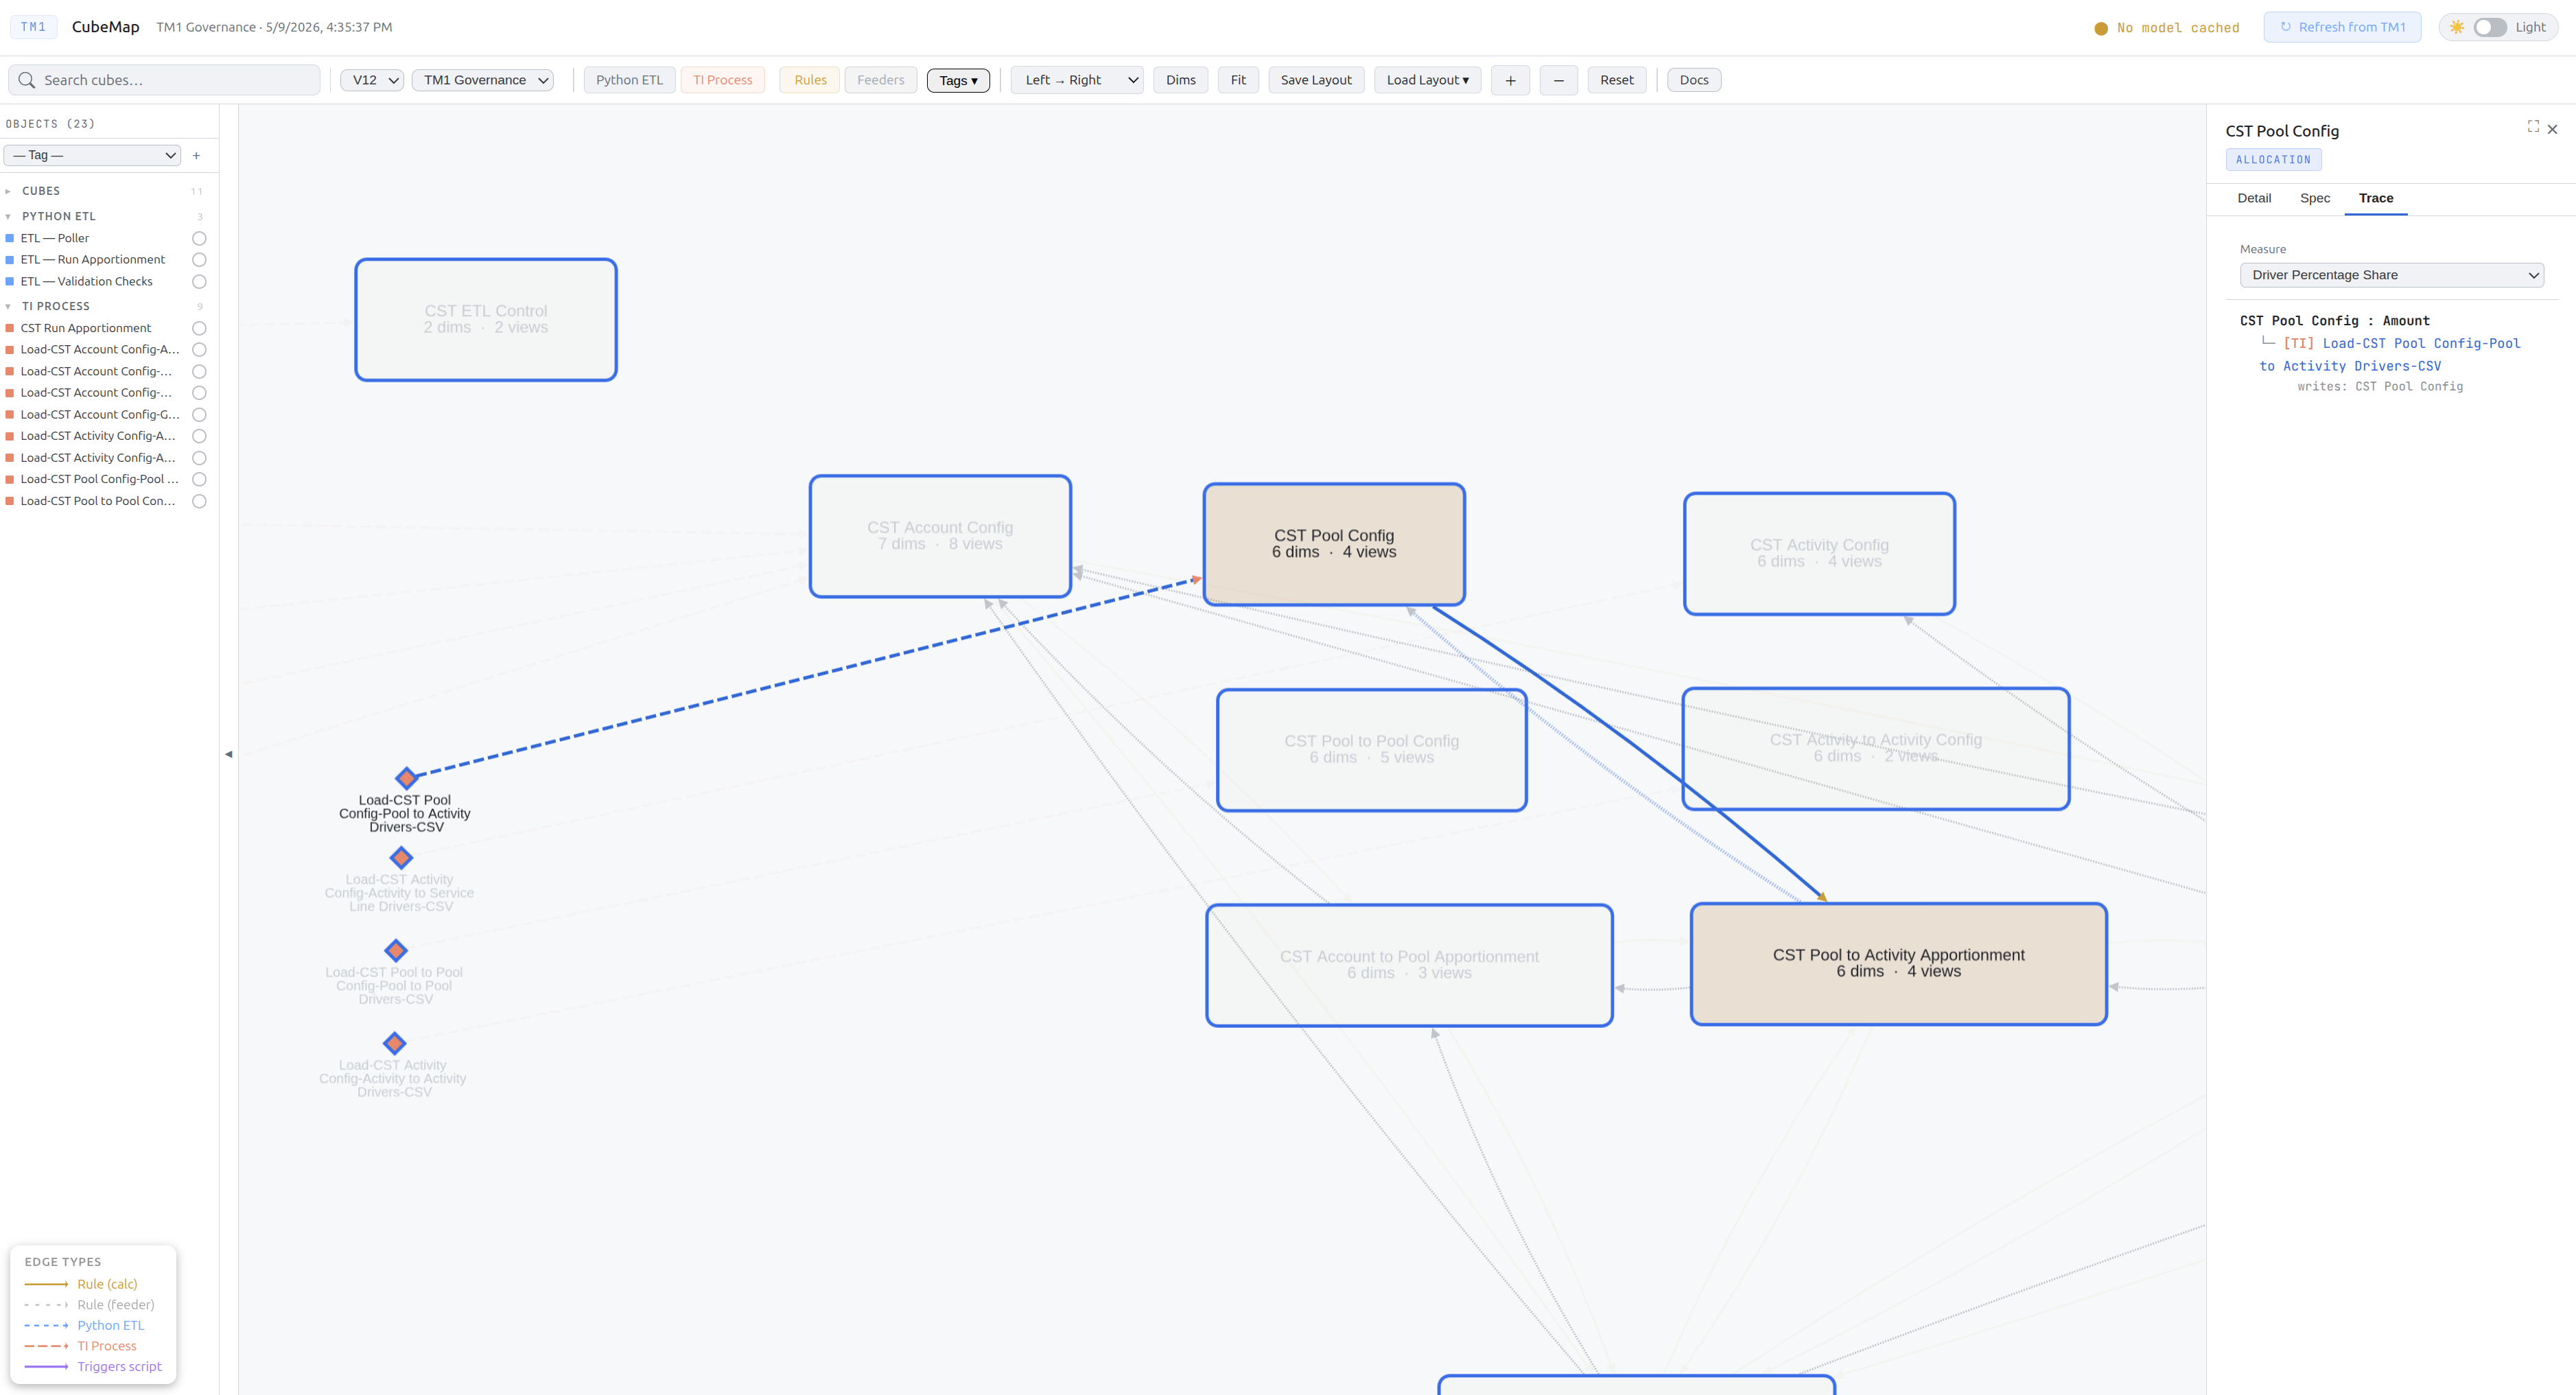
Trace tab:
Displays the calculation lineage tree for a selected measure. See Calculation Trace.
Panel expand
Click the ⛶ button (top right of the panel) to widen the detail panel — useful for reading long rules text or deep trace trees.
Calculation Trace
The Trace tab shows the full data lineage chain for a selected measure — where does this value come from, step by step.
How to run a trace
- Click a cube node to open the detail panel
- Click the Trace tab
- Select a measure from the dropdown — the list shows all measures extracted from the cube’s rules
- Click Trace — CubeMap builds the lineage tree automatically
What the trace walks
CubeMap traces three legs in one pass:
Rules leg — scans the cube’s rules for DB('SourceCube', ..., 'MeasureName') references and follows them into the source cubes recursively.
TI leg — at each cube in the chain, finds TI processes that write to it. Shows what each TI reads from and continues tracing into those source cubes.
ExecuteProcess leg — for each TI process, scans its code for ExecuteProcess('OtherProcess', ...) calls and traces those processes too, following the full call chain.
Reading the trace tree
FCM Consolidation › Net Income
  ├── [Rules] DB('FCM Journal Investment Summary', ..., 'Net Income')
  │     └── [Rules] DB('FCM Journal Investment', ..., 'Amount')
  │           └── [TI] Data.Import.FCMJournalInvestmentSummary
  │                 reads:  FCM Journal Investment
  │                 writes: FCM Journal Investment Summary
  └── [TI] Data.Import.FCMConsolidation.FCMTranslationJournal
              reads:  FCM Translation Journal
              writes: FCM Consolidation
| Node type | Meaning |
|---|---|
[Rules] | A DB() reference found in cube rules |
[TI] | A TI process that writes to this cube |
[Exec] | A process called via ExecuteProcess from a parent TI |
Infrastructure calls: Utility processes that contain no cube writes (dimension management, security, subset creation) are grouped under a collapsed ▶ Infrastructure calls (N) section at the bottom of each TI’s children. Click to expand.
Click to navigate: Any object name in the trace tree is clickable — it navigates the graph to that node.
Guards: Trace stops at 5 hops depth. Cycle detection prevents infinite loops.
Tags
Tags let you annotate cubes and processes with custom labels for filtering, grouping, and AI documentation.
Creating and adding tags
- Click a cube or process node to open the detail panel
- In the Detail tab, find the Tags section
- Type a new tag name and press Enter or click + — the tag is created and applied in one step
- To apply an existing tag, click the tag chip in the input dropdown
Filtering by tag
- Click Tags in the toolbar to open the tag filter dropdown
- Select one or more tags — the graph filters to show only matching objects
- The Copy Module Prompt button appears in the toolbar — see AI Documentation
Tag persistence
Tags are stored inside cube_map/data/tm1_model.json as _tags and survive model refreshes. Switching servers clears the tag display — tags are per-server.
Layouts
Node positions are saved as named layouts so you can maintain multiple views of the same model.
Saving a layout
- Arrange nodes on the graph by dragging them into position
- Click Save Layout in the toolbar
- Enter a name — the layout is saved to
cube_map/data/layouts/
Loading a layout
- Click Load Layout ▾ in the toolbar
- Select a saved layout from the dropdown — positions are restored immediately
The default layout loads automatically on page load and after a Refresh.
AI Documentation
CubeMap has two AI-assisted documentation features — one for individual objects, one for entire modules.
Object Spec
Generates a functional specification for a single cube, TI process, or Python script.
Workflow:
- Click any node to open its detail panel
- Click the Spec tab
- Click Prompt — CubeMap assembles a ready-to-use AI prompt containing the object’s rules or code, its upstream/downstream connections, and detailed instructions
- Copy the prompt and paste it into your preferred AI tool (Claude, ChatGPT, etc.)
- Paste the AI response back into the Spec editor and click Save
What the prompt includes:
- Object name, type, and full connection list
- For cubes — complete rules text
- For TI processes — all four code sections (Prolog, Metadata, Data, Epilog)
- For Python scripts — full script source
- Instructions to produce a structured spec in plain language with no TM1 syntax
Output format: The AI returns a JSON spec with: purpose, inputs, logic, outputs, dependencies, trigger, notes.
Specs persist across model refreshes and are stored per object in rules_analysis/specs/.
Module Prompt
Bundles all objects sharing one or more tags into a single AI prompt — for documenting an entire business module at once.
Workflow:
- Tag all cubes, TI processes, and Python scripts that belong to the module — for example tag them all
"FCM" - Click Tags in the toolbar and select that tag
- Click Copy Module Prompt — the prompt is copied to your clipboard
- Paste into your AI tool
What the prompt includes:
- All tagged objects with their code and connections
- External inputs — objects outside the module that feed into it
- External outputs — objects the module feeds into
- Instructions to produce a module summary, data flow description, and per-object specs
Output format: JSON with moduleSummary, dataFlow, and an objects map.
Use case: Migration documentation — the prompt is written specifically for a developer who has never used TM1, instructing the AI to express all logic as plain mathematics or pseudocode.
TI Edge Detection
CubeMap scans TI process code at extraction time to find cube read and write relationships. These appear as orange dashed edges on the graph.
What it detects:
| Pattern | Type |
|---|---|
CellPutN/S('value', 'CubeName', ...) | Write — literal cube name |
CellGetN/S('CubeName', ...) | Read — literal cube name |
CellIncrementN('value', 'CubeName', ...) | Write — literal cube name |
cVar = 'CubeName' then CellPutN(val, cVar, ...) | Write — variable resolved to literal |
ExecuteProcess('Proc', 'pCube', cubeVar, ...) | Calls a process, passing a cube variable |
What it does not detect:
- Cube names stored in TM1 control cubes and read at runtime
- Fully dynamic cube names built from string concatenation at runtime
Troubleshooting
| Problem | Likely cause | Fix |
|---|---|---|
| Setup form appears on every load | config/servers.json missing or unreadable | Check the config/ volume mount; ensure servers.json is valid JSON |
| “No model cached” on load | First-time run or model was cleared | Click Refresh |
| Refresh returns 409 | Extraction already in progress | Wait for the current extraction to complete |
| “Cannot reach server” | TM1 REST API not running or wrong port | Verify address and port in servers.json; confirm TM1 REST API is enabled |
| V12 auth fails | Invalid OAuth2 credentials | Verify client_id and client_secret; confirm the OAuth2 client has database access |
| V11 auth fails | Wrong credentials or self-signed cert | Credentials are checked first — confirm username and password are correct |
| Cubes missing from graph | System cubes are filtered | Objects starting with } are hidden by design |
| No TI edges on graph | TI code uses runtime-dynamic cube names | Static analysis cannot resolve cube names computed at runtime |
| Python ETL nodes missing | python_sources.json server name mismatch | Ensure the server field in each entry exactly matches the server name in servers.json |
| Blank page on load | Stale JS cache | Hard refresh — Ctrl+Shift+R (Windows/Linux) or Cmd+Shift+R (Mac) |